Senior Living Guide

Find senior living near you
According to the Census Bureau, the number of older adults in the United States grew by almost 40% from 2010 to 2020. Senior living can be a good option for many of these millions of aging adults in the United States.
If you’re considering senior living for yourself or a loved one, this guide is a great place to start. Below, you can learn about the different senior living options and how to know which one is the best fit for you.
What Is Senior Living?
Senior living is a general term used to describe the spectrum of residential communities for older adults, ranging from independent, active communities to nursing homes. All types of senior living have in common that they are residential communities for aging adults. Most, but not all, types of senior living provide services like housekeeping and personal care assistance. As you move up to the higher levels of senior living, more care services are offered.
What Are The Options for Senior Living?
Senior living encompasses several different types of communities for seniors. The spectrum, from most to least independent, includes:
Senior living encompasses several different types of communities for seniors. The spectrum, from most to least independent, includes:
- 55+ Communities: No care services offered and minimal amenities
- Independent Living: No care services are offered and usually plenty of amenities, though this varies depending on the community.
- Assisted Living: Personal care assistance and at least some amenities are always offered.
- Memory Care: Personal care assistance and specialized care, services, and amenities for people living with Alzheimer’s and dementia.
- Continuing Care Retirement Communities: Offer the spectrum of senior living within one community so residents can stay in the same community as their needs change over time.
Below, you can see a comparison of the services and amenities offered in the different types of senior living.
| Care Type | Shared Spaces + Group Activities | Offers housekeeping? | Offers Assistance with ADLs*? | Offers skilled nursing services? | Assistance available 24/7? |
|---|---|---|---|---|---|
| 55+ Communities | ✔ | ✗ | ✗ | ✗ | ✗ |
| Independent Living | ✔ | ✔ | ✗ | ✗ | ✗ |
| Assisted Living | ✔ | ✔ | ✔ | Sometimes | ✔ |
| Memory Care | ✔ | ✔ | ✔ | Sometimes | ✔ |
| Nursing Homes | ✔ | ✔ | ✔ | ✔ | ✔ |
| Continuing Care Retirement Communities | ✔ | ✔ | ✔ | ✔ | ✔ |
*Activities of Daily Living. Learn more about ADLs.
Continue Reading: Learn more about your options for senior living in our Eldercare Options Guide.
What Are The Benefits of Senior Living?
Senior living has many upsides, including:
- Social Opportunities: Residents of senior living have a built-in community of neighbors in the same life stage, helping to prevent loneliness and boredom.
- Activities and Transportation: The planned activities and transportation services offered in many senior living communities help residents stay active in their communities and prevent isolation.
- Support and Assistance: Higher levels of senior living have staff on-site 24/7 to help residents with personal care services and any other needs that arise.
- Simplified Lifestyle: Communities take care of landscaping and external maintenance, and may also offer housekeeping services.
- Nutritious Meals: Many senior living communities offer catered meals, often prepared by professional chefs and with the nutritional needs of older adults in mind.
- Safety and Security: Communities may have gated entrances, front desk security, cameras, and other security measures to keep residents safe.
- Predictable Expenses: In “all-inclusive” style communities, you can pay one monthly fee for your residence, food, activities, transportation, and other services, so you can more easily budget your expenses.
What Are The Drawbacks of Senior Living?
While senior living is a great choice for many older adults, it is not without its drawbacks. Some of the potential downsides of senior living include:
- Stressful Move: Moving is a lot of work, and it can be even more difficult for older people who have spent many years accumulating possessions in their homes.
- Adjustment Period: No matter where you move, there will always be some transition time as you get used to your new surroundings. This will be even more acute if you move to a new city or state for senior living.
- Less Privacy: Compared to living at home, residents of senior living may have neighbors closer by and have less privacy than they’re used to.
- Cost: Senior living can be expensive. However, there is a range of prices and financial assistance options available.
How To Tell If It’s Time for Senior Living
The decision to move to senior living is personal for everyone. However, some common signs that you may benefit from senior living include:
- You’re bored or lonely and want to meet new people in the same life stage
- You no longer want to or are able to cook for yourself
- You want to downsize and be free of home maintenance
- You no longer drive or think you’ll stop driving in the next couple of years
- You take a lot of medications and want help to manage them
- You find it difficult to shave, shower, or do other personal care activities
- You recently fell or had another accident at home
Continue Reading: Learn more about the signs it’s time for assisted living
Payment Options for Senior Living
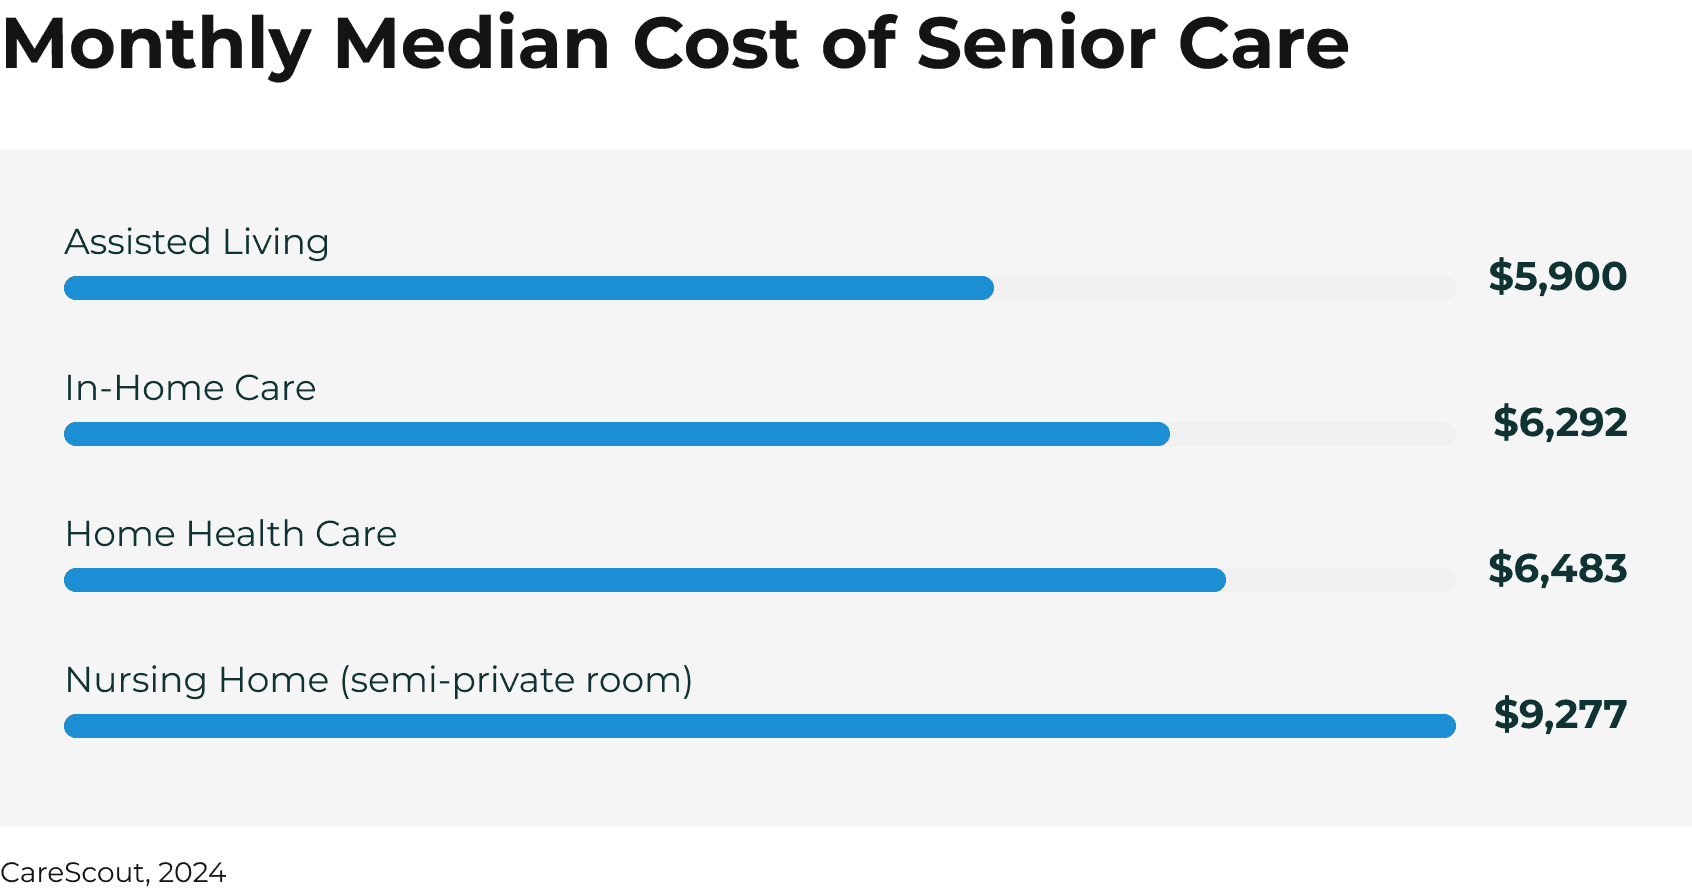
Senior living can be expensive. While independent living costs often hold steady with local apartment living costs, Carescout’s 2024 data shows that other types of senior living cost a median of $6,000/month, or more. The more skilled nursing care you or your loved one need, the higher the price tag. Memory care is often the most expensive senior care for this reason.
While some senior living residents pay out-of-pocket, many utilize financial assistance options including the following:
- Long-term care insurance
- Medicaid and Medicaid waiver programs
- Annuities
- Reverse mortgages
- Veterans benefits
| Continue Reading: Learn more about How to Pay for Assisted Living |
How to Choose Senior Living
Choosing a senior living community for yourself or a loved one is a big task. After determining which type of senior living is the best fit, you’ll want to evaluate the communities’ location, services, amenities, and reputation. To ensure you’re making an informed choice, you’ll want to look into and tour multiple communities, and finding the best ones in your target area can be a challenge.
Caring.com’s expert Family Advisors can help you find the right senior living community for yourself or a loved one. Family Advisors provide no-cost, personalized advice and recommendations for care seekers like you. Call (800) 558-0653 to start the process of finding the right assisted living community for you.
Continue Reading: For more detailed advice on what things to look for in a senior living community for yourself or a loved one, you can read our guide to How to Choose an Assisted Living Community
Senior Living FAQ
Browse our answers hub to find all the answers to your senior care questions.
Top Senior Living Locations
View senior living in top-searched locations
Select your state and browse our filterable database to begin
- Alabama
- Alaska
- Arizona
- Arkansas
- California
- Colorado
- Connecticut
- Delaware
- District Of Columbia
- Florida
- Georgia
- Hawaii
- Idaho
- Illinois
- Indiana
- Iowa
- Kansas
- Kentucky
- Louisiana
- Maine
- Maryland
- Massachusetts
- Michigan
- Minnesota
- Mississippi
- Missouri
- Montana
- Nebraska
- Nevada
- New Hampshire
- New Jersey
- New Mexico
- New York
- North Carolina
- North Dakota
- Ohio
- Oklahoma
- Oregon
- Pennsylvania
- Rhode Island
- South Carolina
- South Dakota
- Tennessee
- Texas
- Utah
- Vermont
- Virginia
- Washington
- West Virginia
- Wisconsin
- Wyoming