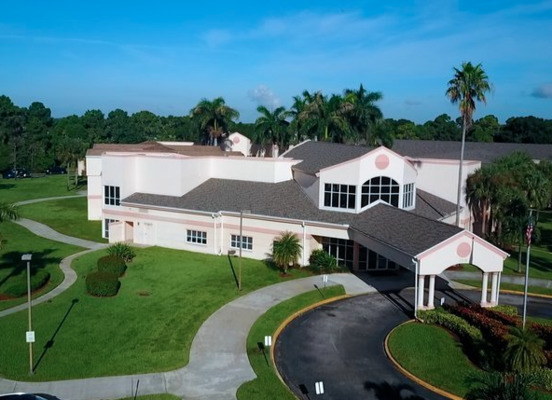
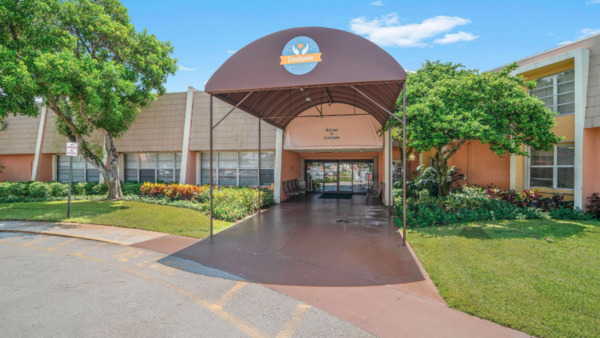
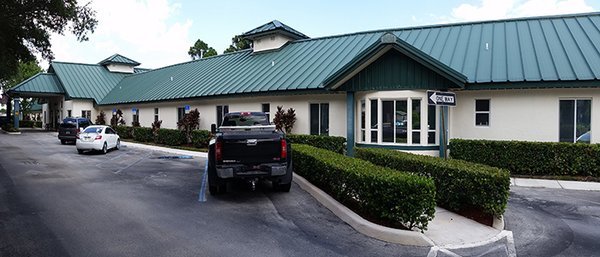
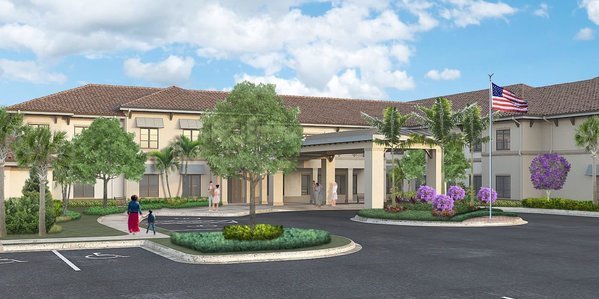
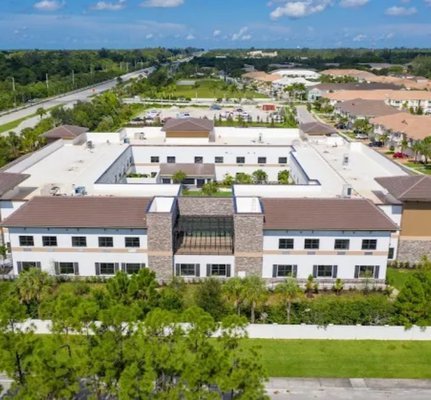
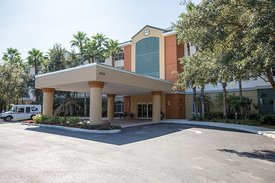
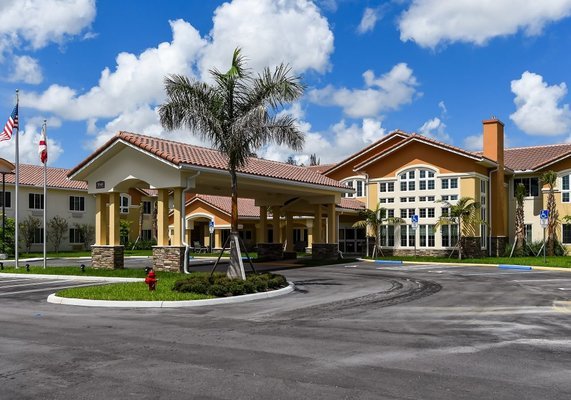
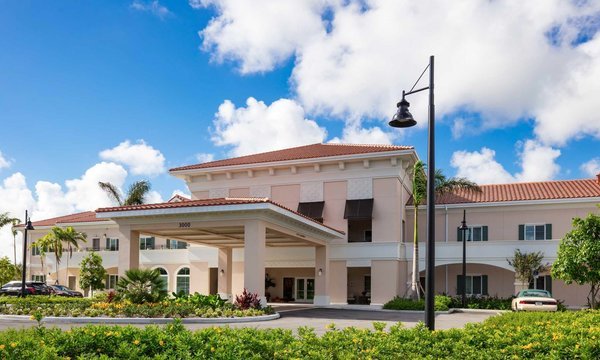
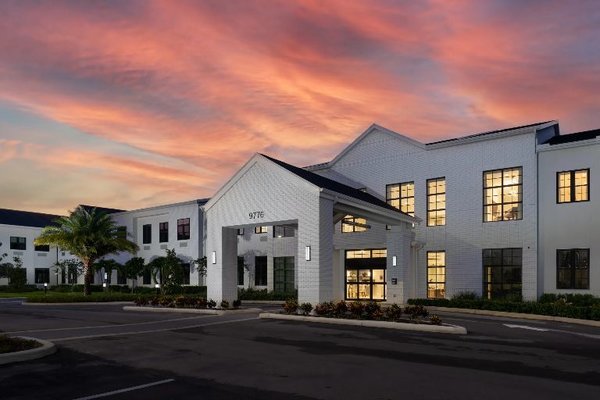
American House Boynton Beach is a modern, resort-style senior living community located at 9776 S Jog Road in Boynton Beach, Florida. Offering independent living, assisted living, and memory care, the community provides a full continuum of care that allows residents to age in place comfortably while enjoying a vibrant and engaging lifestyle. Situated in Palm Beach County, the community is conveniently located near shopping, dining, healthcare providers, and the beautiful South Florida coastline.
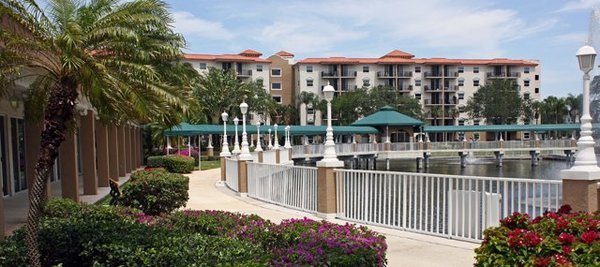
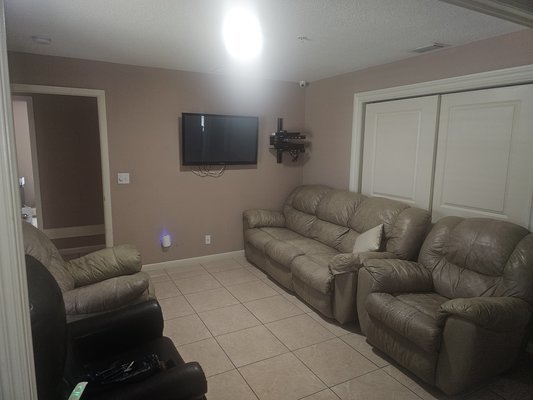
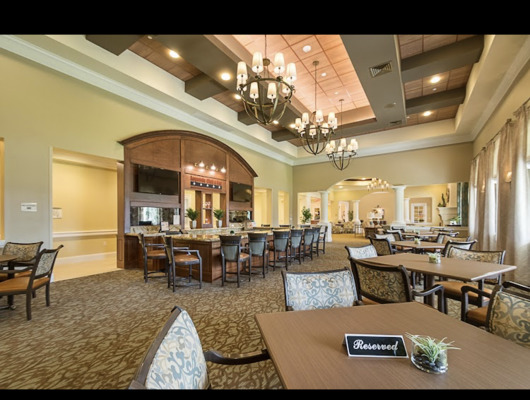
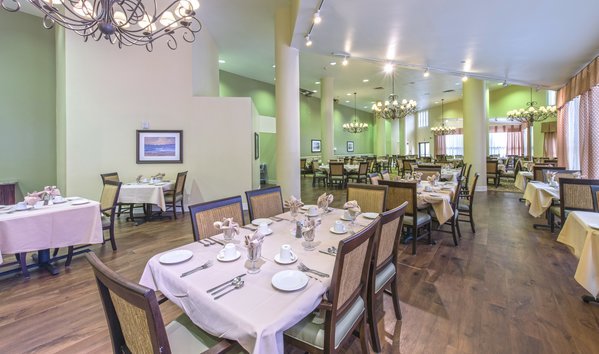
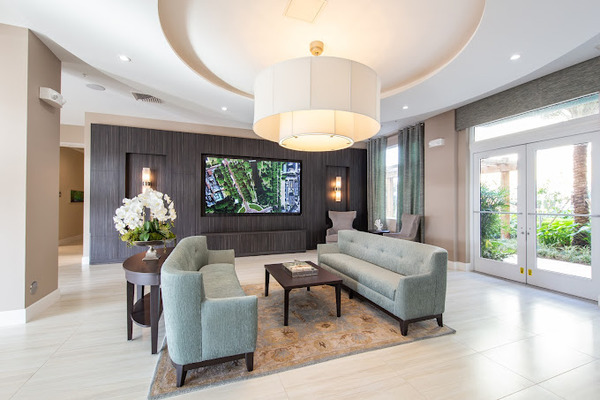
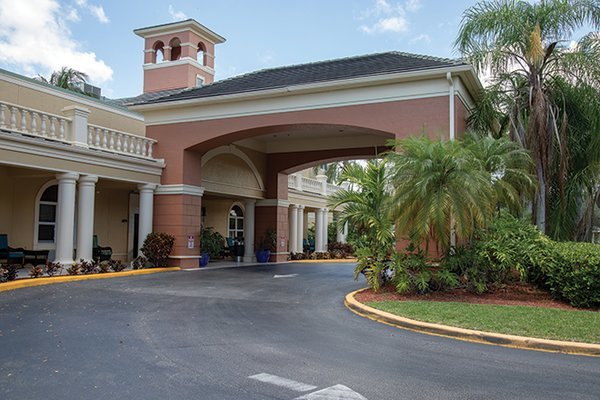
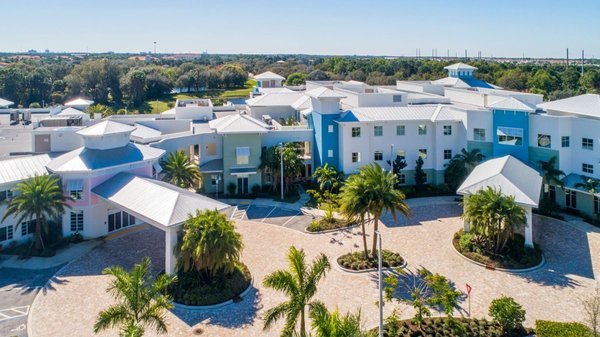
The community features a contemporary two-story layout with approximately 130 residences, including a mix of studio, one-bedroom, and two-bedroom apartments. Designed with both comfort and accessibility in mind, residences include private bathrooms, modern finishes, and spacious floor plans. The community also offers inviting common areas such as elegant dining rooms, lounges, and activity spaces, along with landscaped outdoor courtyards that provide relaxing spaces to enjoy the Florida weather.
Residents at American House Boynton Beach enjoy a wide range of amenities and services that support a maintenance-free lifestyle. These include restaurant-style dining with chef-prepared meals, housekeeping and laundry services, scheduled transportation, and concierge-style support. On-site amenities such as a fitness center, movie theater, salon and spa, library, and activity rooms provide opportunities for wellness, recreation, and social connection. A robust calendar of daily activities, events, and enrichment programs helps residents stay active and engaged.
Care services are personalized to meet each resident's unique needs, with trained staff available 24/7 to assist with activities of daily living such as bathing, dressing, grooming, and medication management. The community's specialized Living Well Memory Care program offers a secure and structured environment for individuals living with Alzheimer's disease or other forms of dementia, focusing on cognitive engagement, safety, and meaningful daily experiences.
A defining feature of American House Boynton Beach is its resort-style atmosphere combined with compassionate, individualized care, creating an environment where residents can maintain independence while receiving the support they need. The pet-friendly setting, thoughtfully designed amenities, and strong emphasis on community and connection contribute to a warm and welcoming place to call home.
Located near local attractions such as Boynton Beach Oceanfront Park, Delray Beach's Atlantic Avenue, and several shopping centers and medical facilities, residents have convenient access to both recreation and essential services.
With its modern design, comprehensive care options, and engaging lifestyle offerings, American House Boynton Beach provides seniors with a supportive and enriching environment where they can thrive, stay connected, and enjoy each day with comfort and confidence.
To learn more about this provider's license and review other available state reports, please visit: Florida Agency of Health Care Administration