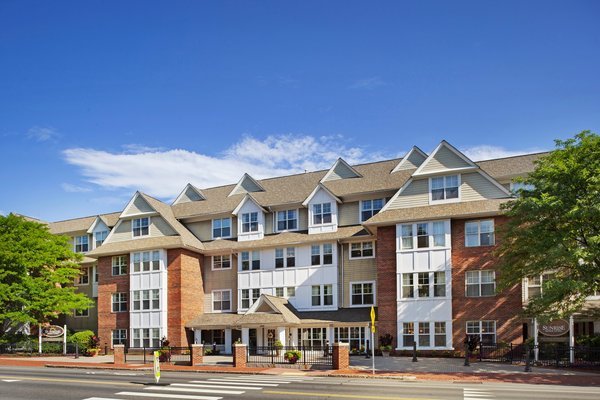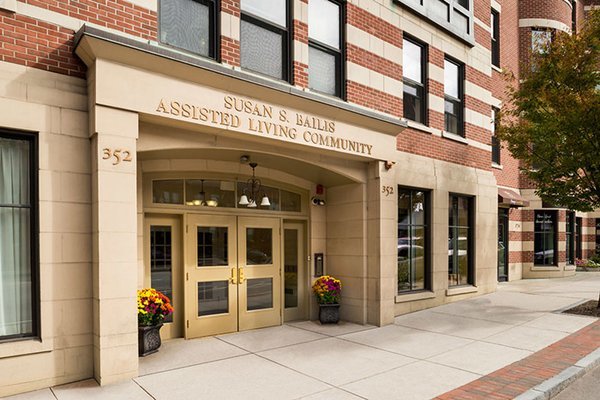
Susan Bailis Assisted Living
352 Massachusetts Avenue, Boston, MA 02115
3.5
(6 reviews)
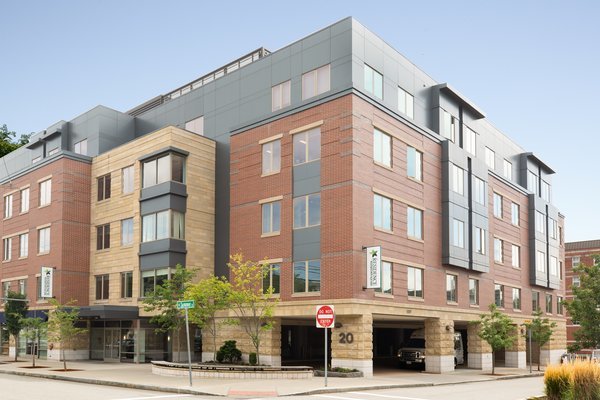
"I toured Susan Bailis Assisted Living. It's centrally located in downtown Boston, and its facilities are clean and well-maintained. The units are small, and the prices are high for the area. The staff was great. They seemed close to the residents."
$6,900