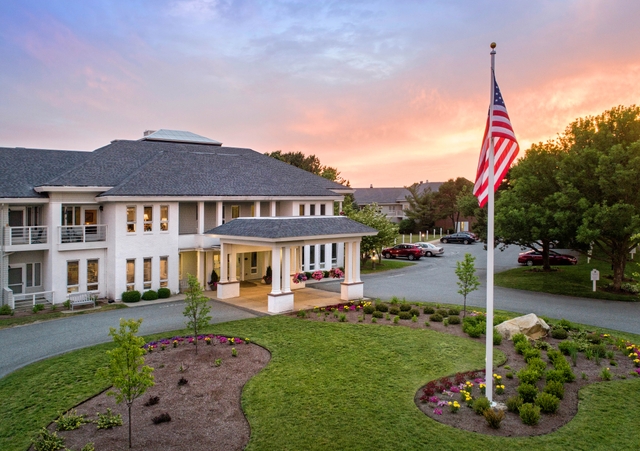
Nursing Homes in Barnstable County, Massachusetts

We found 36 nursing homes near Barnstable County, MA. Read reviews, check ratings and pricing, get contact information, and learn about housing options, amenities, and medical care offered by browsing the Barnstable County skilled nursing facilities listed below.

36 Barnstable County, Massachusetts, Nursing Homes
Sort by:

  1.  11646
    4.0
    Emeritus at Cape Cod
    Hyannis, MA 02601
    "I have a favorable impression of this facility. I went to tour the facility along with my sister ..." more


  2. 0.0
    Windsor Nursing & Retirement Home
    South Yarmouth, MA 02664

    Liberty Commons
    North Chatham, MA 02650

    0.0
    Mayflower Place Nursing Center
    West Yarmouth, MA 02673

    0.0
    Pavilion , the
    Hyannis, MA 02601


    0.0
    Windsor Nursing & Retirement Home
    South Yarmouth, MA 02664


    0.0
    Royal Nursing Center, LLC
    Falmouth, MA 02540

    0.0
    Jml Care Center Inc
    Falmouth, MA 02540


    0.0
    Liberty Commons
    North Chatham, MA 02650


CaringScore

Overview HealthScore: 6.8 CostScore: 2.3 LivabilityScore: 7
5.3
of 10

CaringScore for Barnstable County, MA

CaringScore was designed to help millions of Americans find the best places to retire, age in place, or receive eldercare. The CaringScore for nursing homes in Barnstable was based on more than 50 factors in three key categories: health, cost, and livability. By compiling and analyzing this data, Caring.com is able to rate the quality of life you or a loved one might expect should you choose nursing homes in Barnstable.

A CaringScore can range from 1 (worst) to 10 (best), and provides a quick way to compare cities, counties, and even specific zip codes. With a CaringScore of 5.3, Barnstable is on par with the national average for those seeking nursing homes.

The charts below highlight a few of the factors we used to calculate the CaringScore for Barnstable. Choose a category score to learn more.

6.8
of 10

HealthScore for Barnstable County, MA

HealthScore, a component of the overall CaringScore for nursing homes in Barnstable, rates a region on a scale of 1 (less healthful) to 10 (more healthful). It's specifically tailored to anyone looking for nursing homes. The HealthScore for Barnstable is based on the availability of healthcare resources, air and water quality, the overall health of the local population, and other key factors. With a HealthScore of 6.8, Barnstable rates above average for those seeking nursing homes.

Easy access to physicians -- especially geriatricians and other key specialists -- is important to older adults seeking nursing homes. At 262.6 physicians per capita, Barnstable scores 19.1 percent better than the national average. Barnstable trails the national average in geriatricians per capita by 100.0 percent, with 0, and closely matches the national average in specialists per capita, with 20.1. These medical specialists include cardiologists, oncologists, and orthopedists. The average life expectancy from birth in Barnstable is 80.6 years -- 3.5 percent higher than most of the country. Air quality in Barnstable -- one factor in gauging the healthfulness of a region -- is 84.3 percent below average, and water quality -- another key measure of Barnstable's environmental health -- trails the national average by 27.3 percent.

Doctors Per Capita Barnstable County, MA Nat'l Avg
Physicians 262.6 220.5
Geriatricians 0 1.3
Cardiologists 9.6 7.7
Oncologists 3.2 3.5
Orthopedists 7.3 7
2.3
of 10

CostScore for Barnstable County, MA

CostScore, part of the overall CaringScore for nursing homes in Barnstable, rates the cost of living for older adults on a scale of 1 (more expensive) to 10 (less expensive). It's specifically tailored to people looking for nursing homes. The CostScore for Barnstable is based on data such as the average monthly cost of nursing homes in the region, the cost of housing and healthcare, regional tax rates, and other key factors. With a CostScore of 2.3, the costs associated with nursing homes in Barnstable are generally more expensive than the national average.

The average monthly cost for nursing homes in Barnstable is $9,977 , which is 70.0 percent more expensive than the rest of the country. Overall, the cost of living for Barnstable indexes at 39.0 percent higher than the national average. Average healthcare costs are 16.0 percent more expensive than the national average, and the cost of housing is 115.0 percent more expensive than average.

Cost of Living Barnstable County, MA
Aggregate Index 139
Healthcare Index 116
Housing Index 215
Food Index 116
Utilities Index 125
Transportation Index 101
7
of 10

LivabilityScore for Barnstable County, MA

LivabilityScore makes up part of the overall CaringScore for nursing homes in Barnstable. On a scale of 1 (less livable) to 10 (more livable), it's a rating of the quality of life in a region, specifically tailored to those looking for nursing homes. The LivabilityScore for Barnstable is based on weather, crime rates, economic factors, average age of the population, and other key demographics. With a LivabilityScore of 7, Barnstable rates above average for nursing homes.

Weather is an important factor in choosing the best place for nursing homes. The sun shines an average of 201 days each year in Barnstable, which is about average in the U.S. With an average temperature of 22°F in January, winters in Barnstable tend to be similar to other parts of the country, and summers are often more temperate than other places, averaging 78°F in July.

Local crime rates are another important indicator. The violent crime rate in Barnstable is 25.0 percent lower than the national average, and the property crime rate index is 4 of 10, which is in line with the national average. At $60,275 per year, the population of Barnstable earns a better than average median household income. Barnstable has an unemployment rate of 11.30 percent, roughly 24.2 percent higher than the national average. And about 24.60 percent of the population in Barnstable is of retirement age -- 65 or older -- which exceeds the national average by 86.9 percent.

Amenities Per Capita Barnstable Nat'l Avg
Parks 3.7 136.1
Libraries 15.4 18.8
Places of Worship 59.9 220.5
Public Transit 22.5 110.4
Grocery Stores 173.8 97.7
Pharmacies 13.2 13.8

More Information About Nursing Homes

  • Talking With Barbara McVicker: Caregiving in a Dysfunctional Family
    Interview - ...nd an emotional level. Also sprinkled throughout the book are tips on everything from filling the silence during parental visits to picking nursing homes to finding resources such as the Alzheimer's Association's Safe Return program, which provides help when a person with Alzheimer's wanders...
  • The Patient Claimed He Was Getting Worse In Rehab. Could He Be Right?
    Blog Post - ...ist, others end up feeling like a clichéd "terrible nursing home experience." This isn't surp rising, given that rehab often takes place in nursing homes, where quality can range from excellent to spotty. Mr. Z. didn’t know what to do. It didn’t help that like many older people, he had no f...
  • Is Parkinson's and dementia fatal and heriditary?
    Question - Hi all. My grandfather is 76 and he was diagnosed with Parkinson's disease in 2003. As long as i can remember.. he's been sick with this. I'm 16 now and he was recently diagnosed with the Dementia side of Parkinson's. My grandmother has been taking care of him since he was diagnosed and she can't take care of him anymore...
  • Dementia Patients Seem to Benefit From Small Group Homes
    News - FRIDAY, Sept. 16 (HealthDay News) -- People with dementia appear to be better off in small group homes rather than large nursing homes because they offer a domestic environment where patients can live as individuals, new research suggests. And small group homes offer the a...