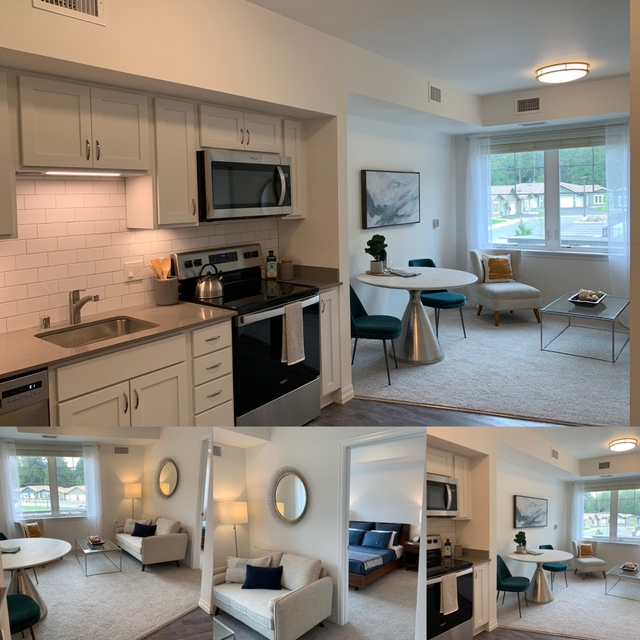
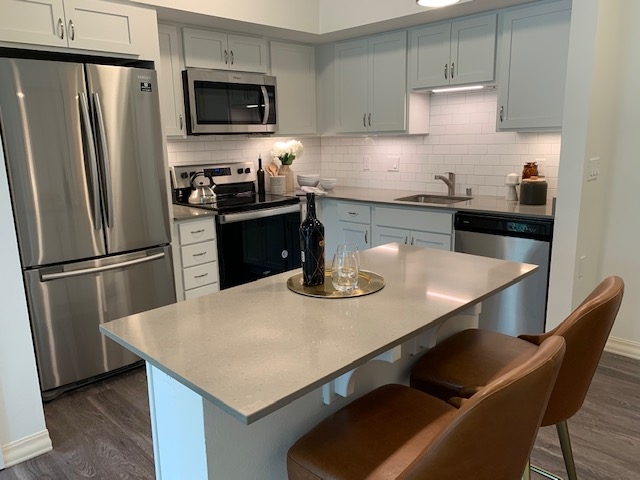
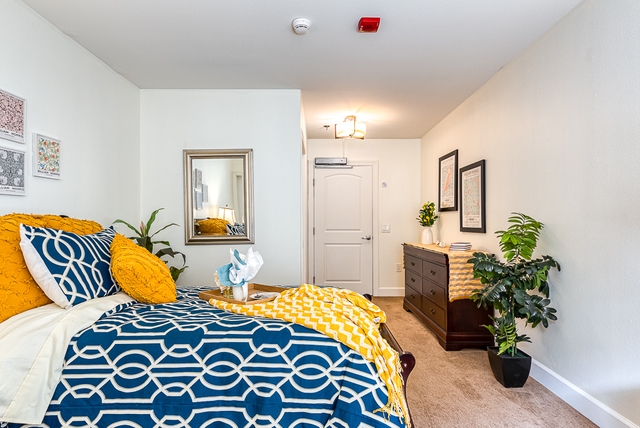
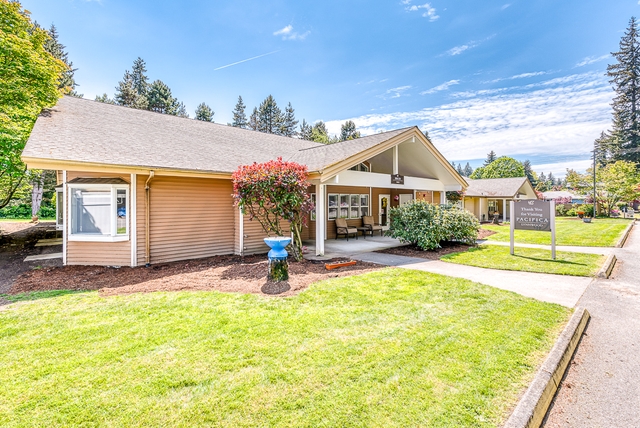
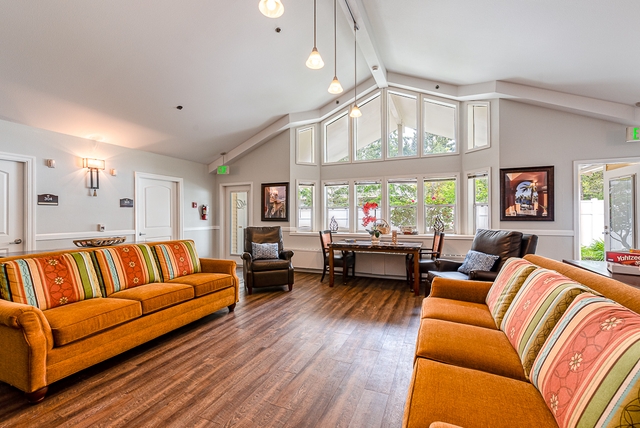
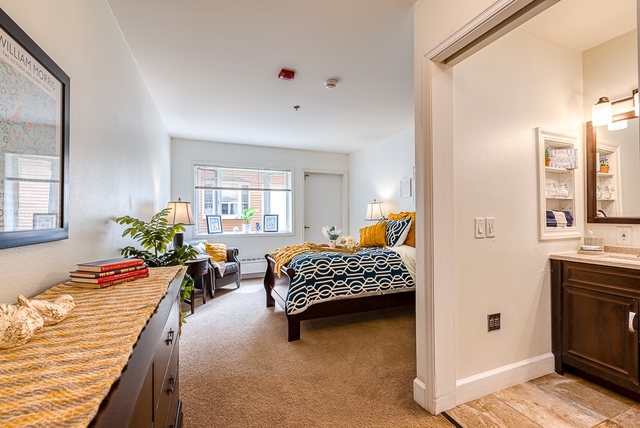
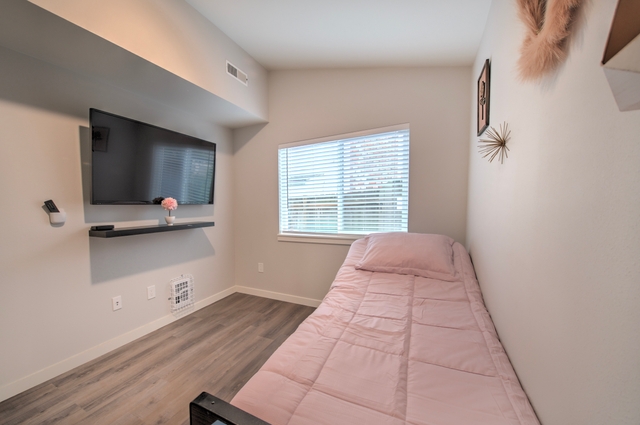
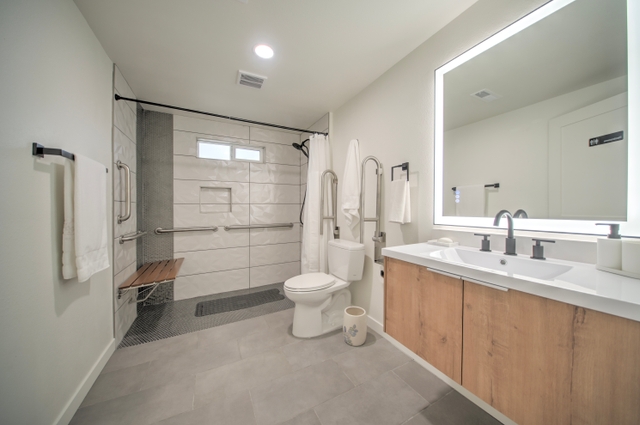
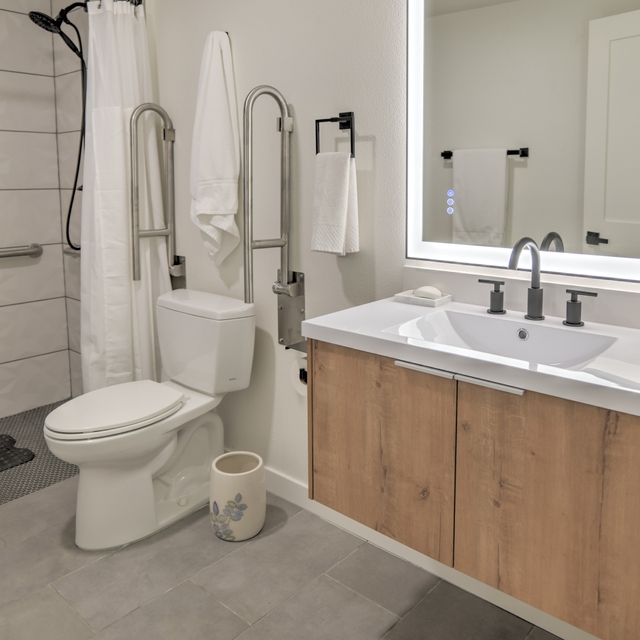
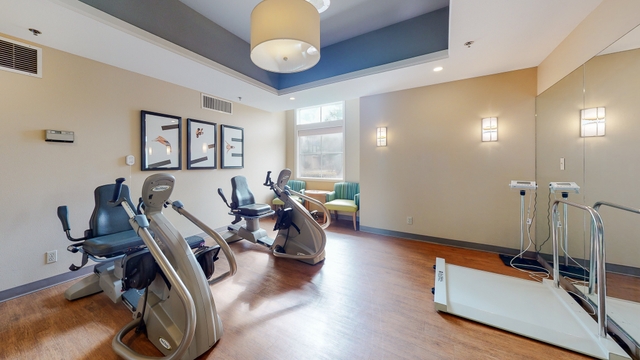
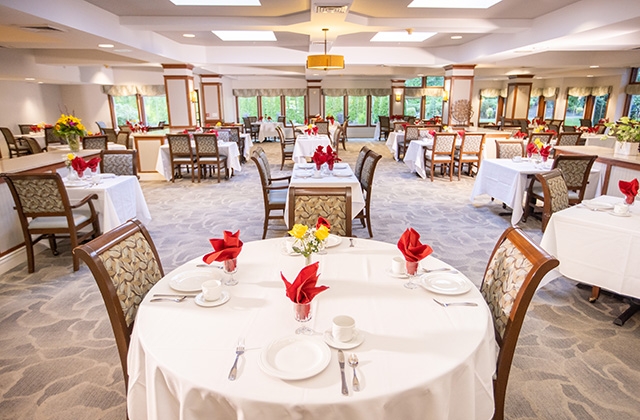
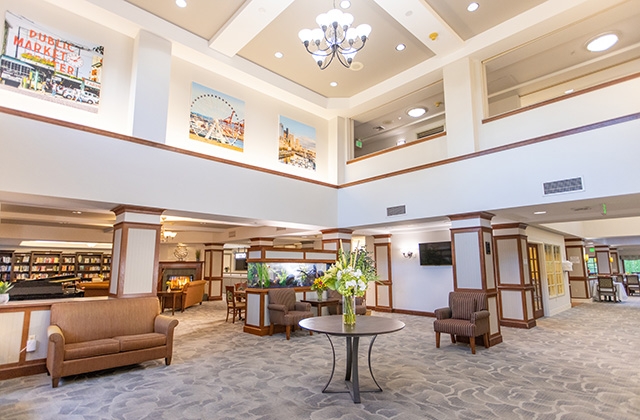
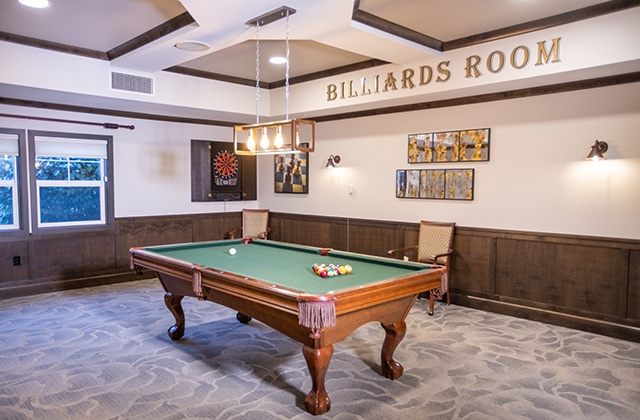
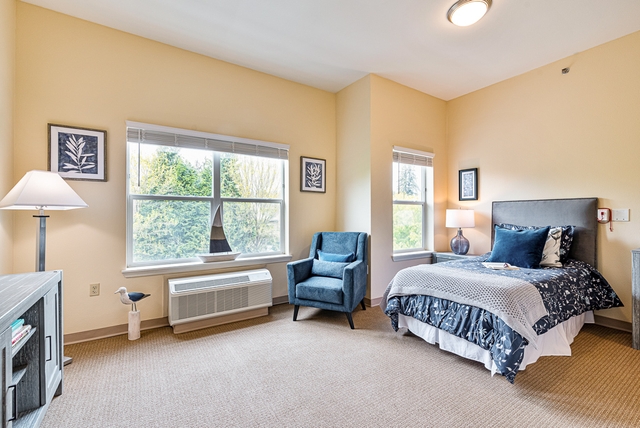
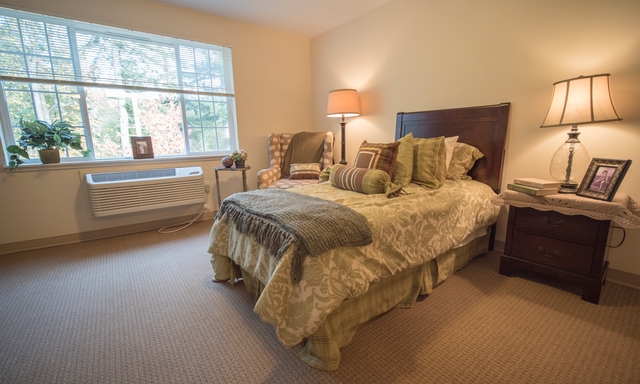
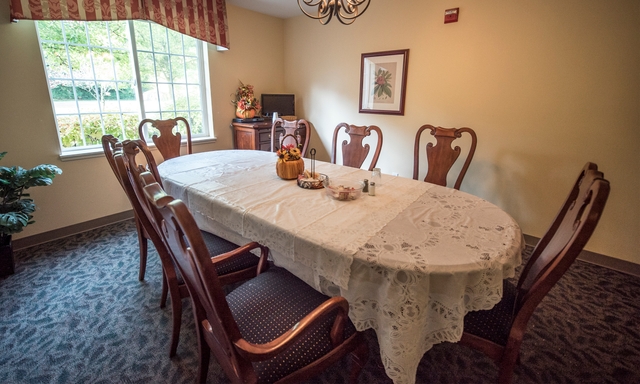
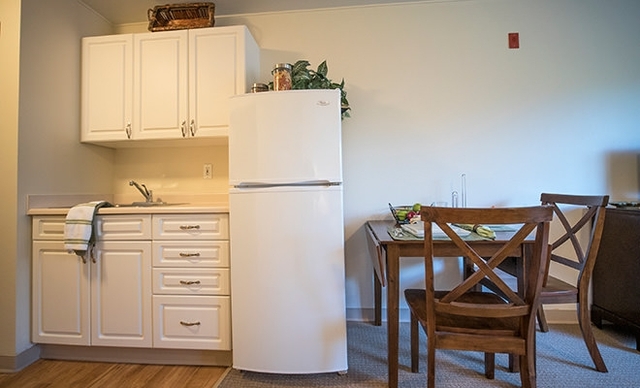
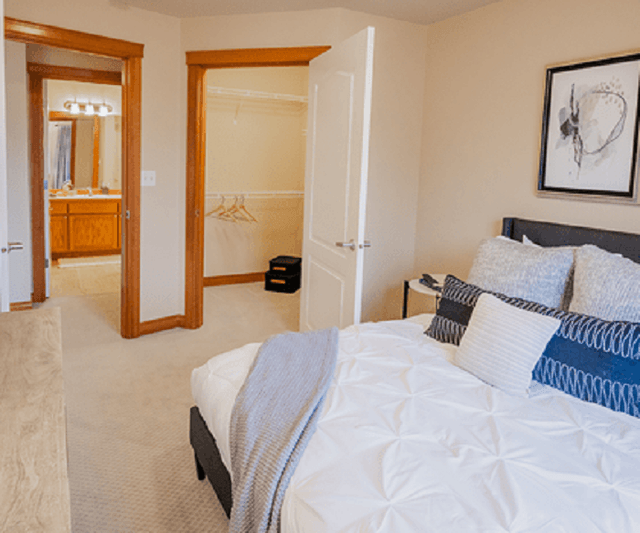
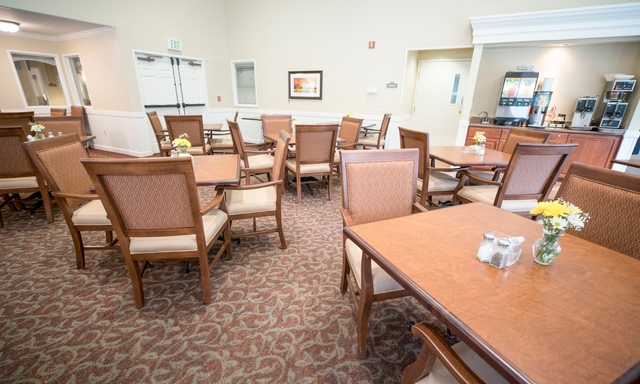
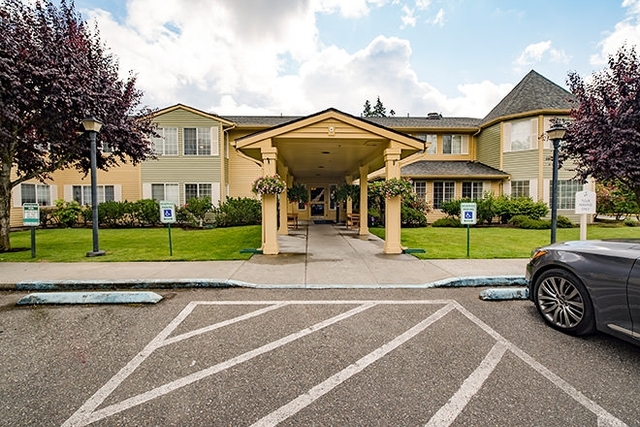
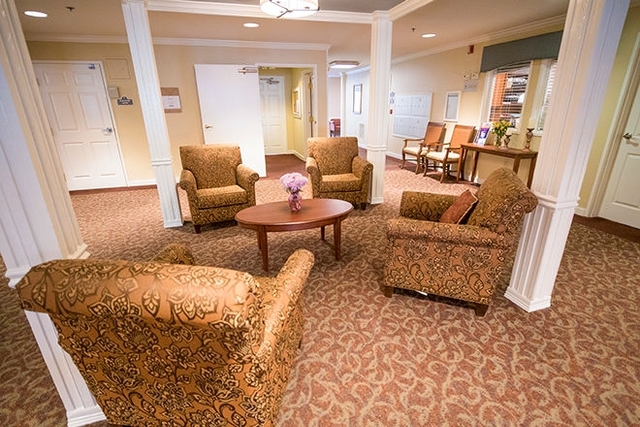
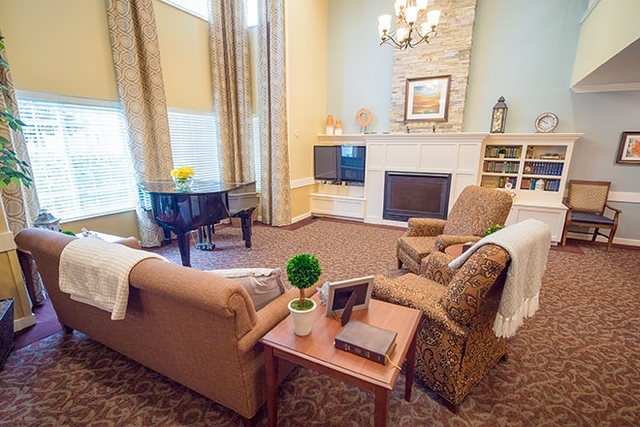
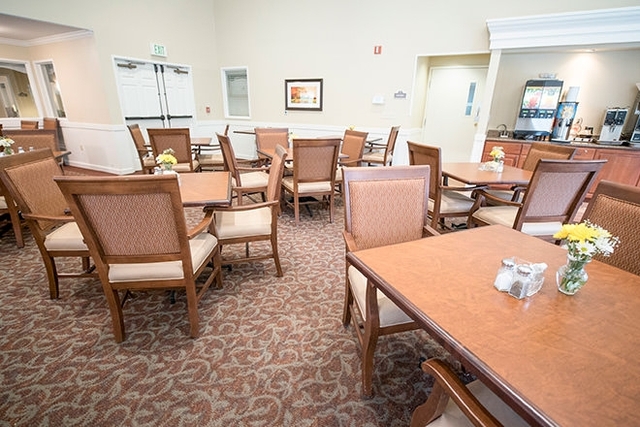
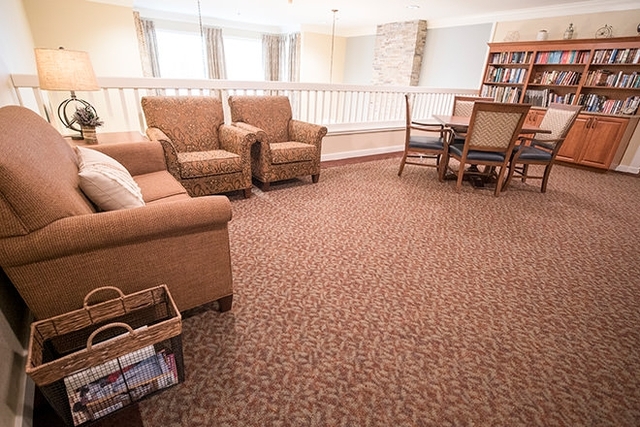
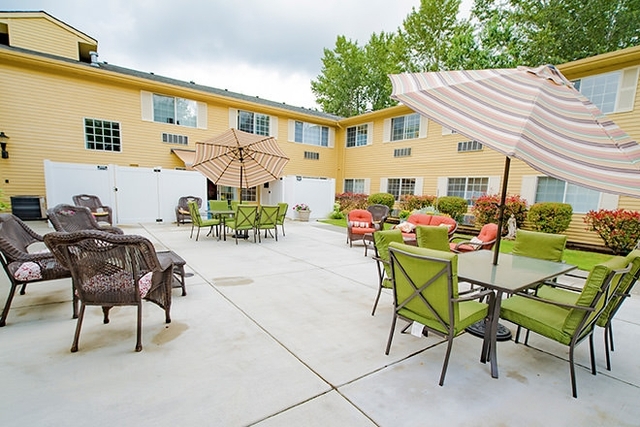
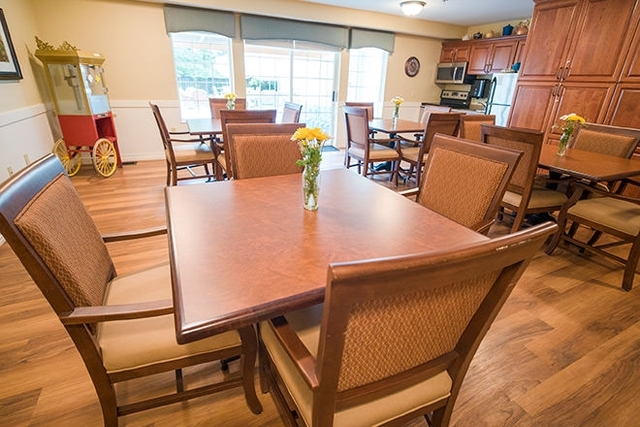
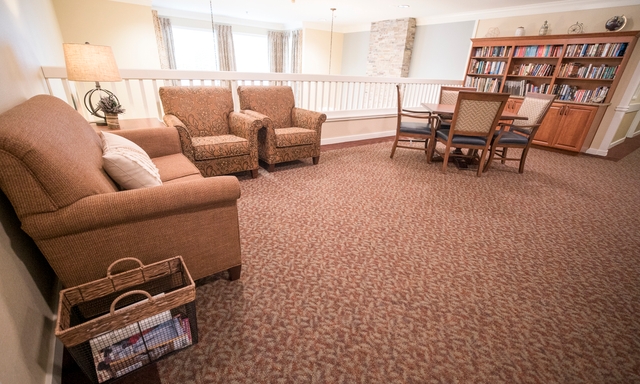
Assisted living is a residential care option for older adults who need support with daily living tasks while maintaining as much independence as possible. Residents are cared for in a homelike environment, and services typically include meals, housekeeping, laundry, personal care and medication management. At a median cost of $5,750, Lynnwood is one of the most budget-friendly options in Washington state for this type of care. However, care costs in the area are above the national average of $4,500.
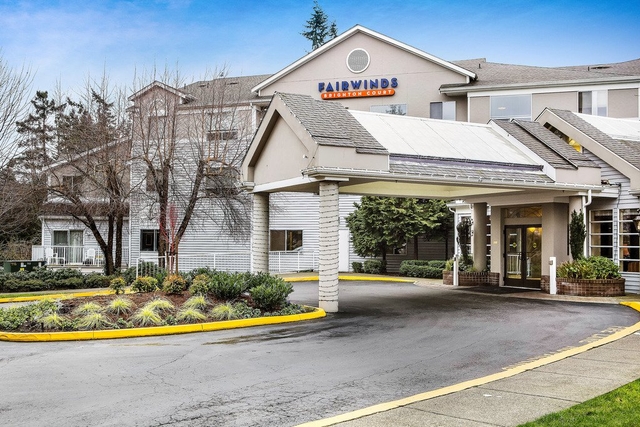
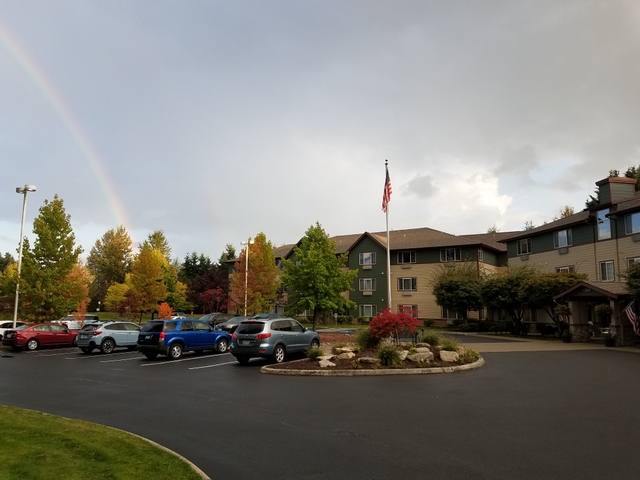
This page lists some of the pros and cons of retiring in Lynnwood and offers a cost comparison of assisted living facilities in the area and other regions. Also included is a helpful list of local resources for seniors and their families.